How to Read a Histogram
A camera histogram is one of the most powerful exposure tools available to photographers, yet it’s often misunderstood or ignored entirely. At first glance, it may look like a confusing graph, but learning how to read it takes only a few minutes — and it can dramatically improve your photography.
What Is a Histogram?
A histogram is a graph that shows the distribution of brightness values in an image. It helps photographers evaluate exposure by displaying how dark or bright different parts of a photo are.
The left side of the histogram represents shadows and darker tones, the center represents midtones, and the right side represents highlights and brighter tones. The taller the graph appears in a particular area, the more pixels exist at that brightness level.
Unlike viewing a photo on a camera screen — which can be affected by screen brightness or ambient light — a histogram provides an objective view of exposure.
There are two common types of histograms used in photography.
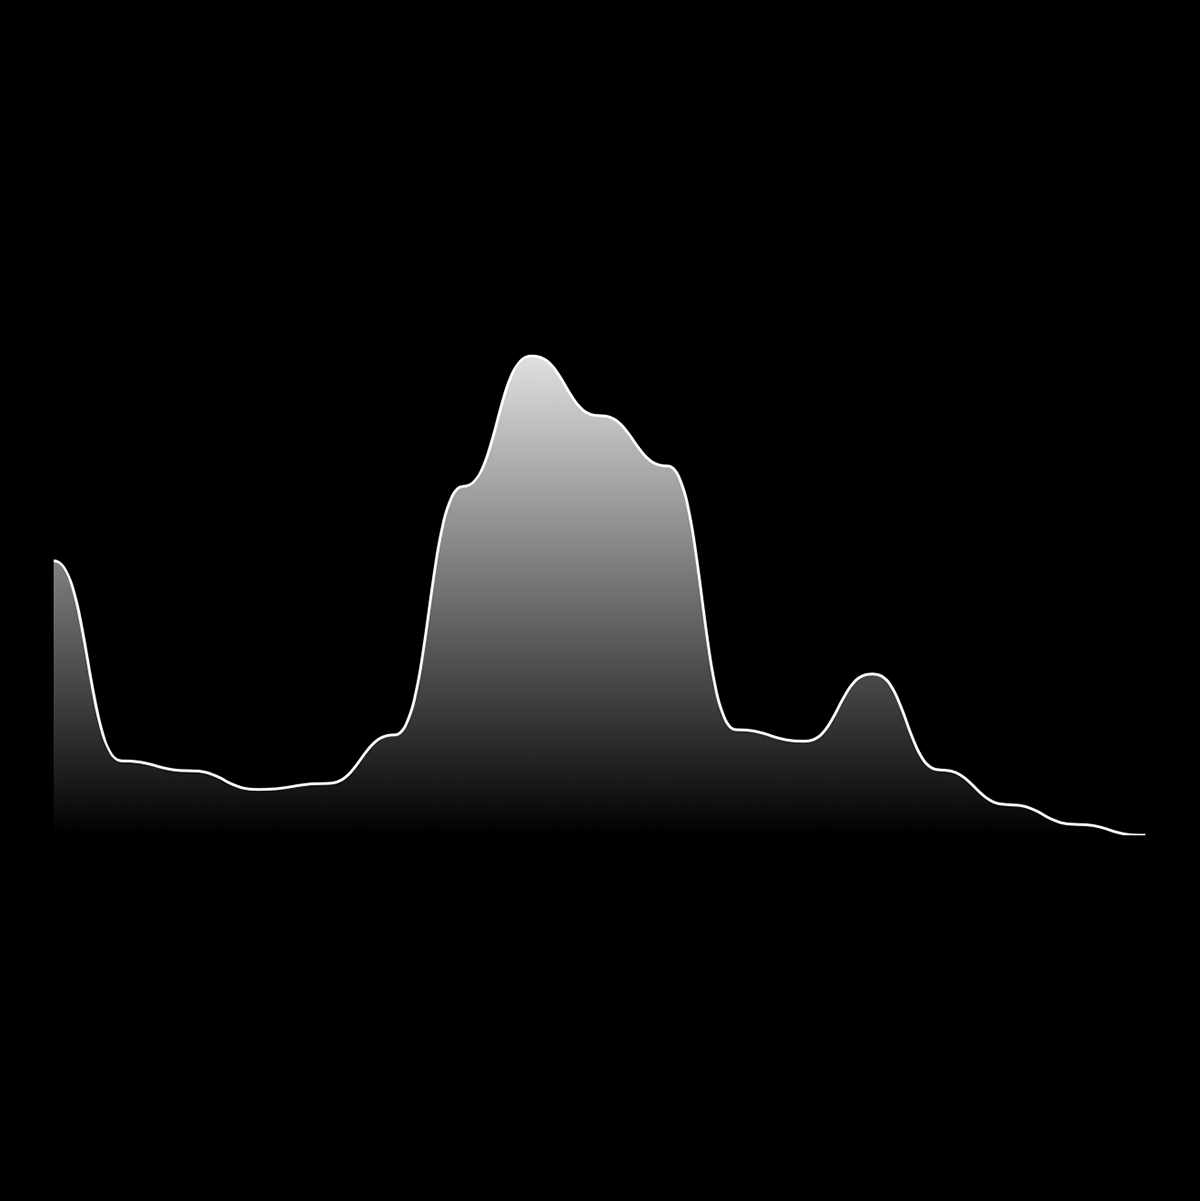
Luminance Histogram
A luminance histogram displays the overall brightness of an image using a single graph. It combines all color information into one exposure reading and is the most common histogram shown on cameras.
This type of histogram is useful for quickly checking whether an image is underexposed, overexposed, or clipped in the shadows or highlights.
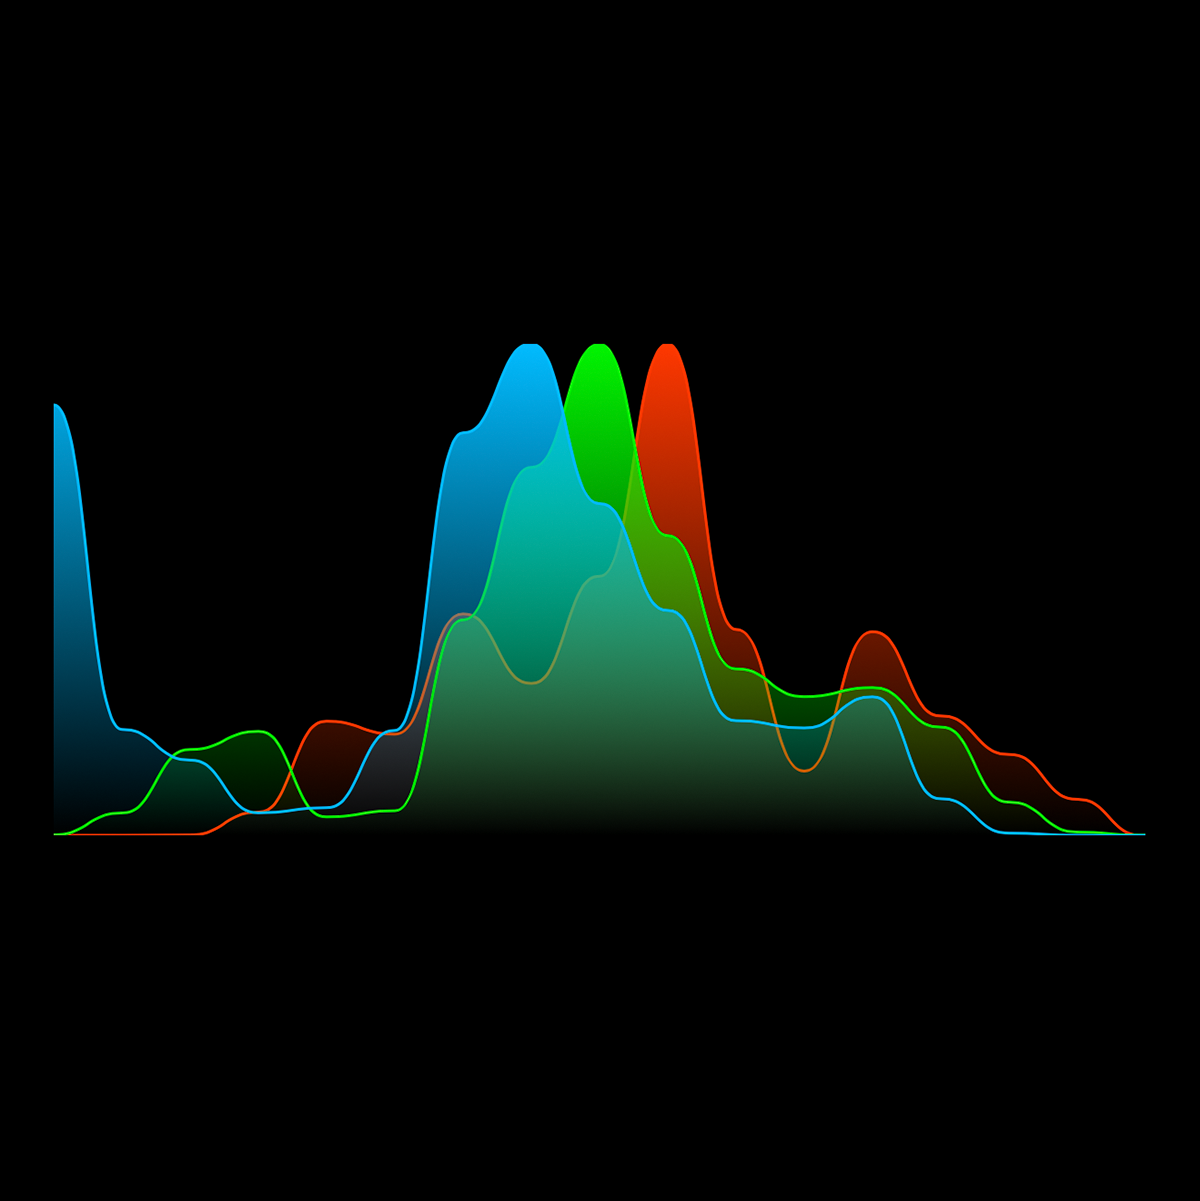
RGB Histogram
An RGB histogram separates the image into red, green, and blue color channels. Instead of one graph, it displays three overlapping graphs representing each color channel.
RGB histograms are especially useful when photographing colorful scenes, sunsets, stage lighting, or anything with strong color saturation. Even if the overall luminance exposure looks correct, one individual color channel may still be clipped, causing a loss of color detail.
Using a Histogram to Set Exposure
Many properly exposed images produce a balanced histogram that resembles a bell curve, with most of the data concentrated near the middle and gradually tapering toward the shadows and highlights. However, there is no such thing as a “perfect” histogram. The ideal shape depends entirely on the scene you are photographing.
For example, a snowy landscape may naturally produce a histogram weighted toward the right side because most of the image is bright. A night scene or silhouette may produce a histogram concentrated on the left side because the image contains mostly dark tones.
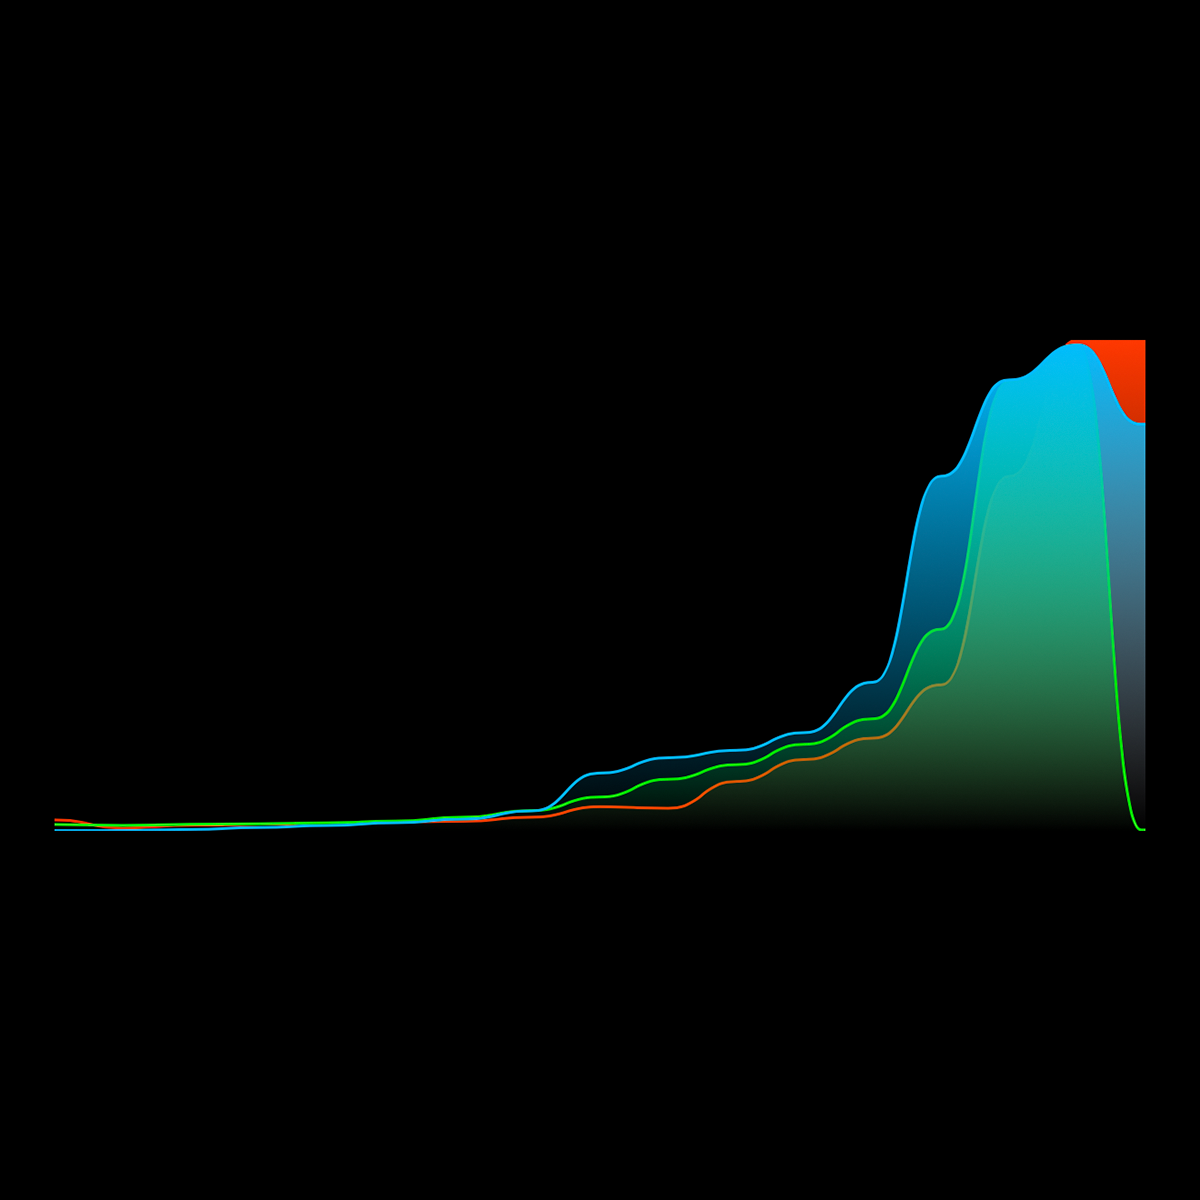
Exposing to the Right
“Exposing to the right” refers to adjusting exposure so the histogram shifts as far to the right as possible without clipping highlights.
Because digital camera sensors capture more image data in brighter tonal ranges, exposing slightly brighter can preserve more detail and reduce noise, especially in shadows. This technique is commonly used in RAW photography.
However, if the histogram touches or climbs the far right edge, highlight clipping may occur. Clipped highlights contain no recoverable detail and usually appear as pure white areas in the image.
The goal is to push exposure toward the right while still preserving important highlight detail.
Exposing to the Left
A histogram pushed heavily toward the left side indicates a darker exposure. This may be intentional for low-key photography, night scenes, or dramatic silhouettes.
Underexposure itself is not always a problem, but excessive shadow clipping can lead to lost detail and increased image noise when brightening the photo later in editing.
If the histogram is stacked tightly against the left edge, important shadow detail may be permanently lost.
Avoiding Clipping
The edges of the histogram are especially important. Data pressed against the left edge indicates clipped shadows.
Data pressed against the right edge indicates clipped highlights.
In many situations, a small amount of clipping is acceptable or even unavoidable. For example, specular reflections, direct sunlight, or deep shadows may naturally exceed the camera’s dynamic range.
The key is deciding which parts of the image matter most and exposing accordingly.
Using The Histogram for White Balance

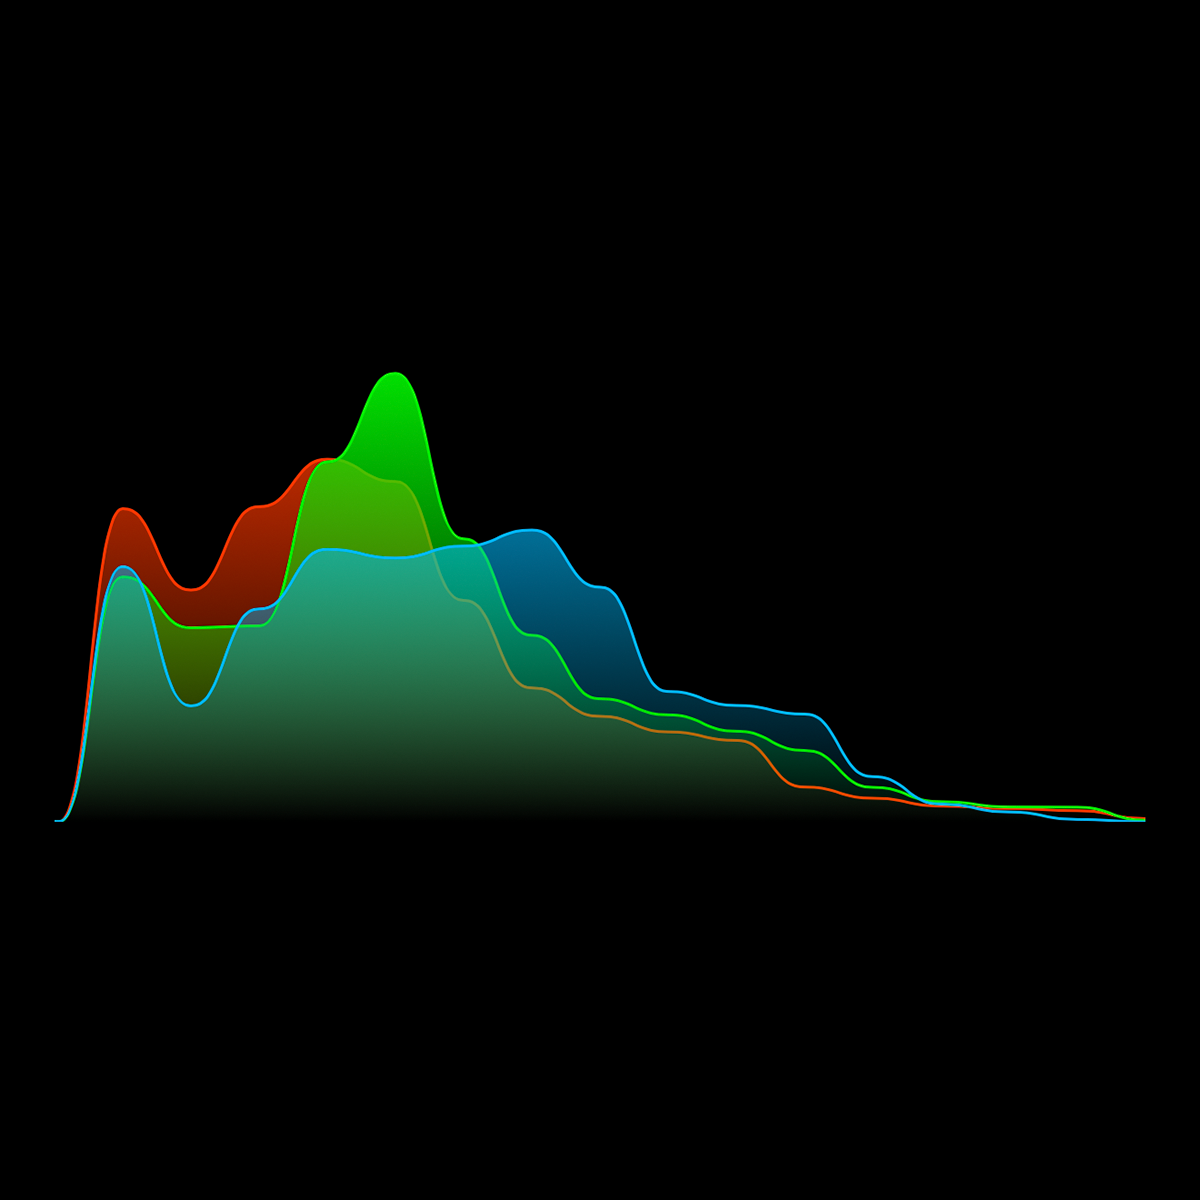
A histogram can also help you evaluate white balance by revealing color imbalances in an image. Instead of looking only at brightness, the RGB histogram separates the image into red, green, and blue channels. When one color channel is noticeably shifted compared to the others, it often indicates a color cast.
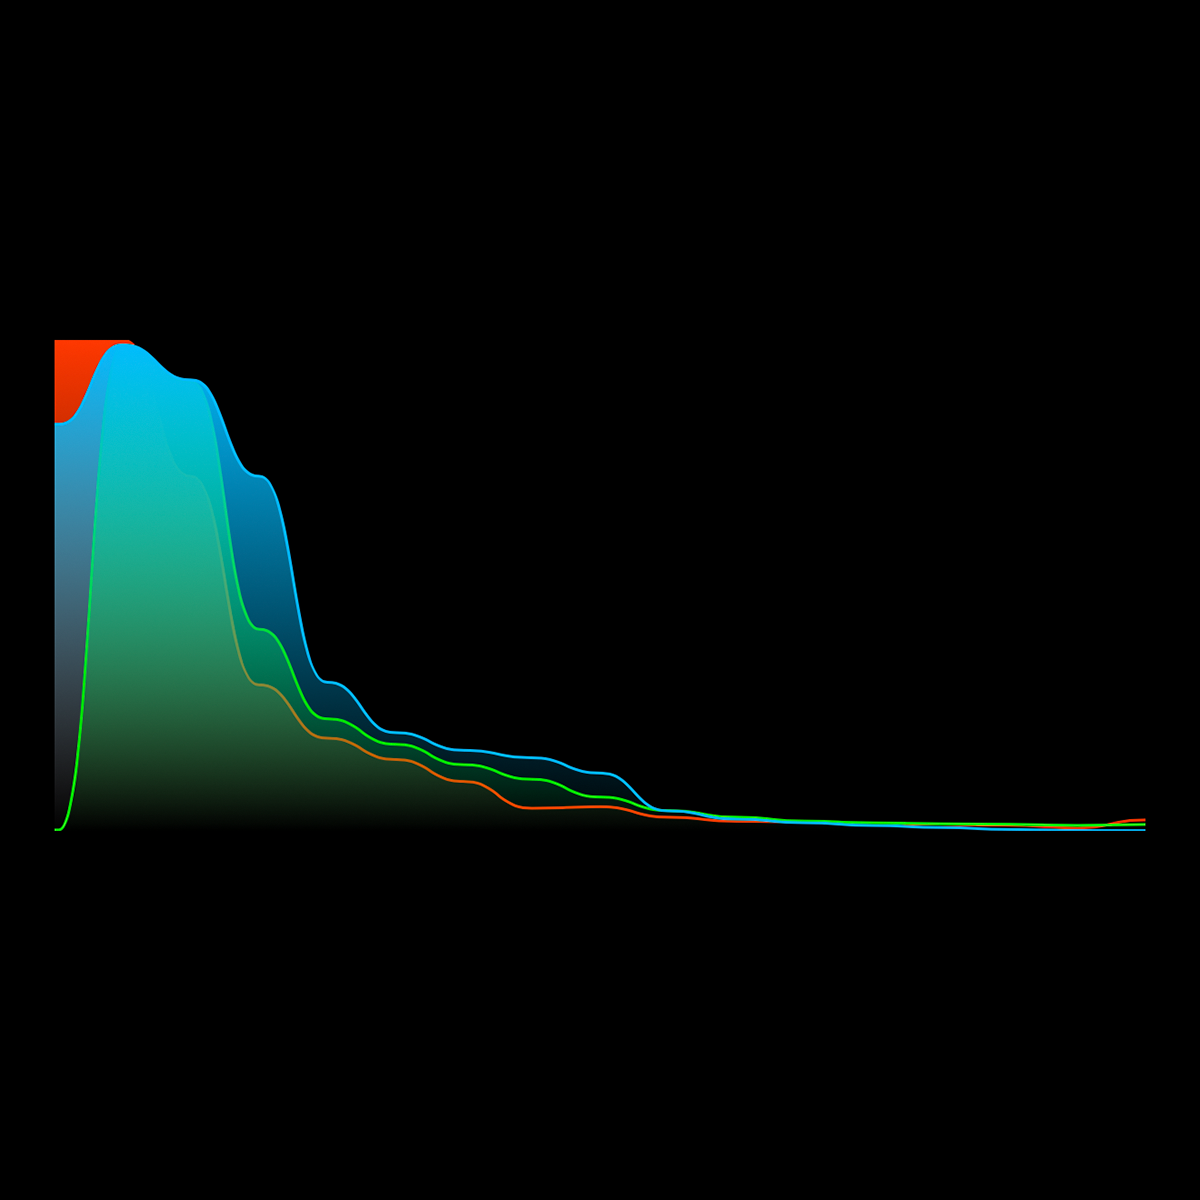
In the second image, the histogram shows one channel dominating the others, creating an unwanted color tint across the photo. For example, a strong blue shift may make the image appear cold, while an excess of red or orange can make it feel too warm.
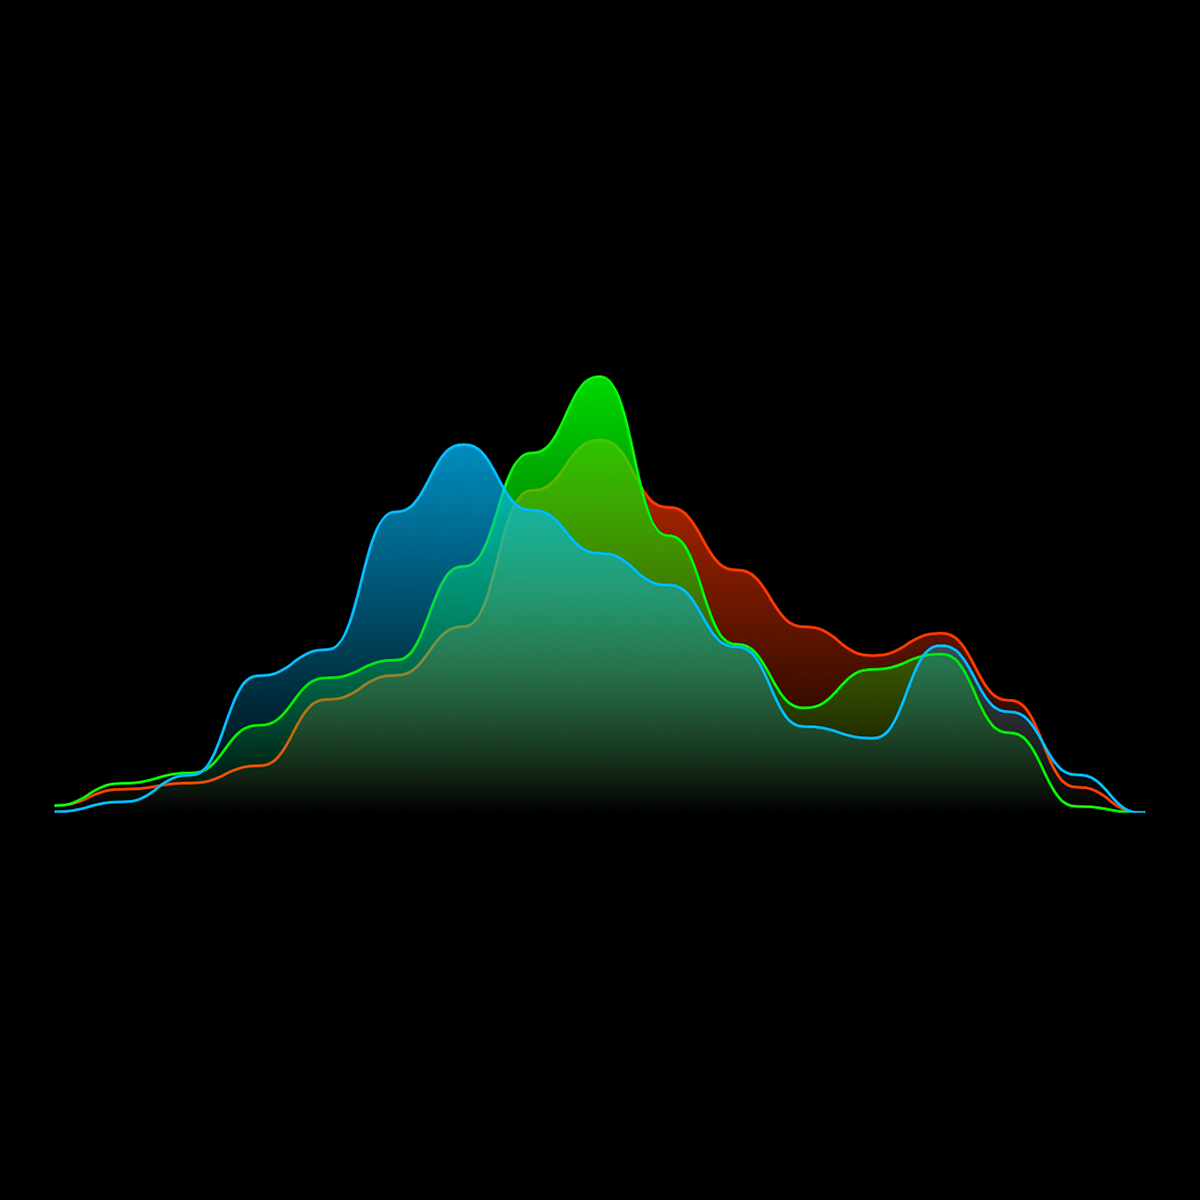
In the first image, the RGB channels are more balanced and aligned. Neutral areas appear truly neutral, and colors look more natural overall. While the channels do not need to overlap perfectly in every scene, a large separation between them is usually a sign that white balance needs adjustment.
You can use the histogram as a quick reference in situations where the display may be misleading — such as bright sunlight, dark environments, or scenes with strong ambient lighting. By checking the RGB histogram while adjusting white balance, you can achieve more accurate and consistent color.
Using Histograms with Camera M
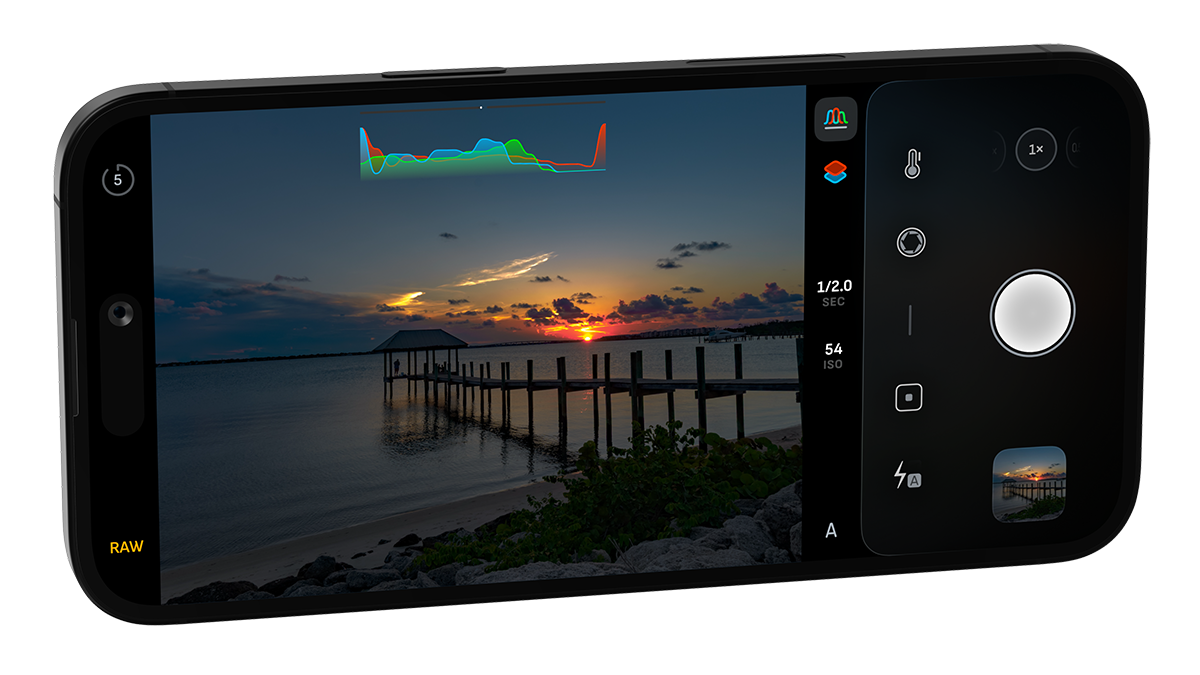
Camera M offers a variety of histograms to help you monitor exposure and white balance in real time. Each histogram is beautifully animated with vibrant, intuitive colors for quick readability while shooting.
The RGB and luminance histograms available on the main capture screen and in the white balance interface are intentionally simplified, making them easier to read at a glance during capture.
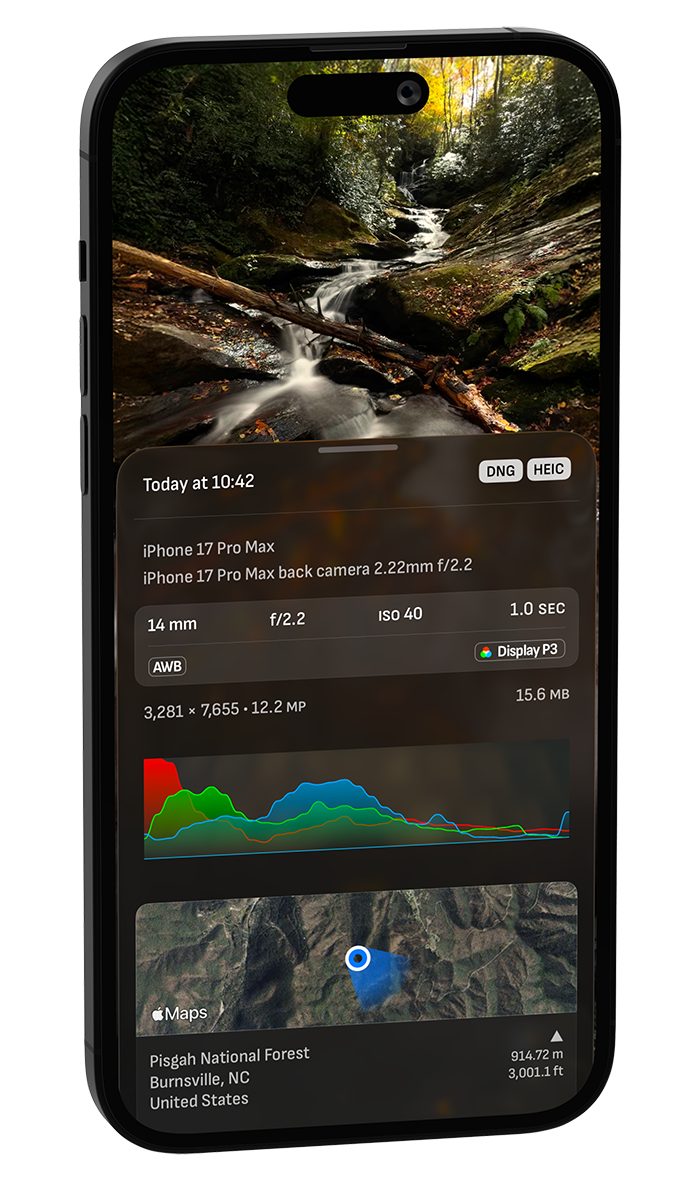
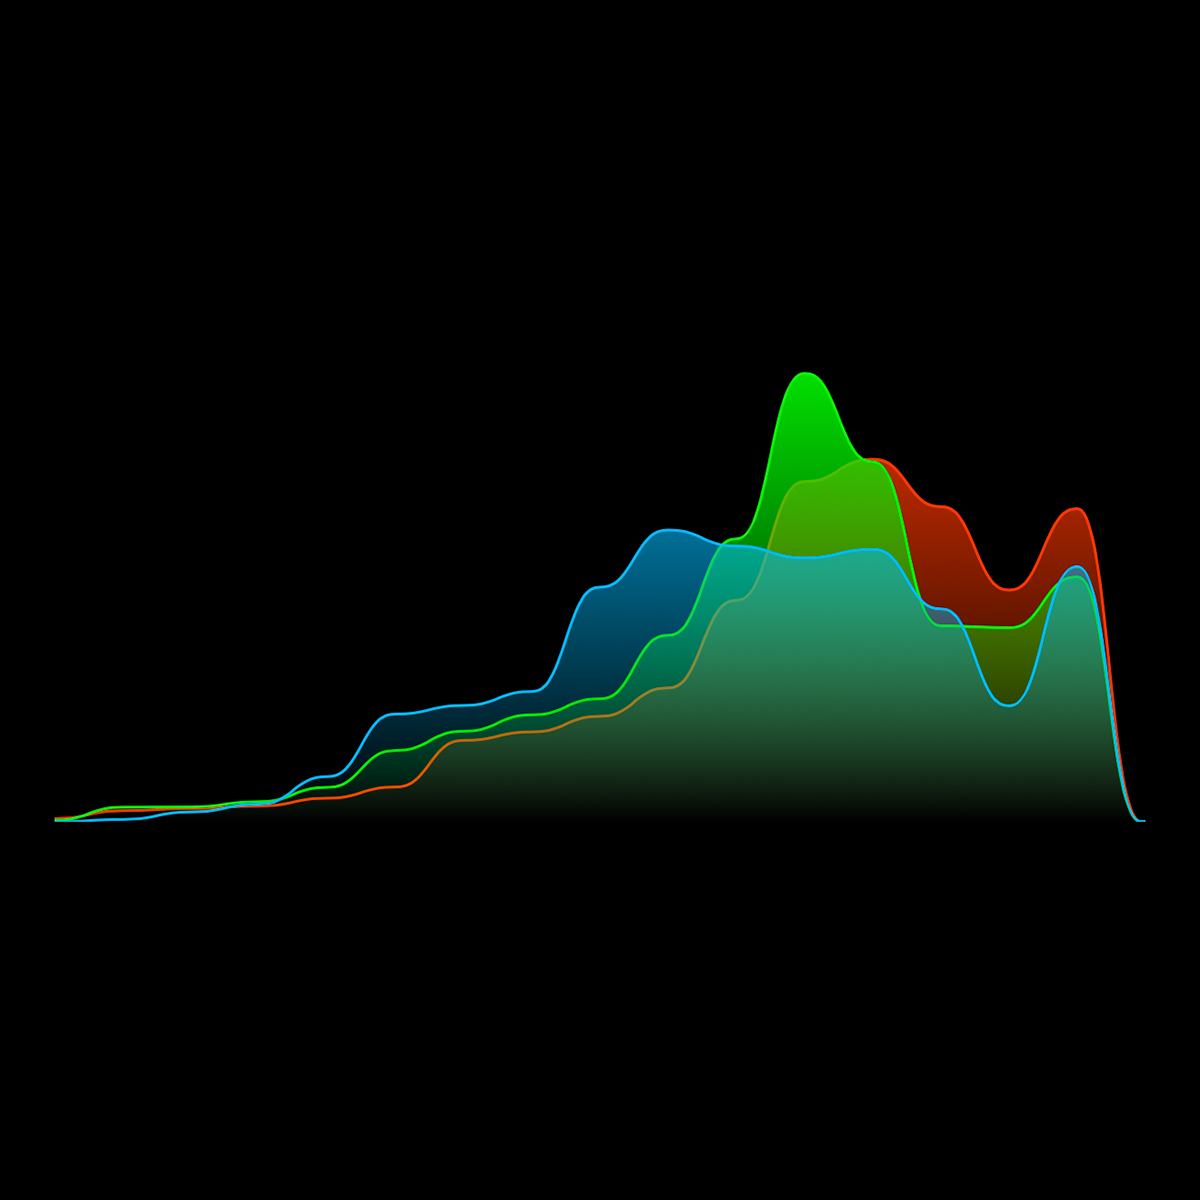
Within the photo library, the EXIF viewer provides a more detailed histogram for deeper image analysis after capture. This expanded view allows you to examine tonal distribution and RGB channel information with greater precision.
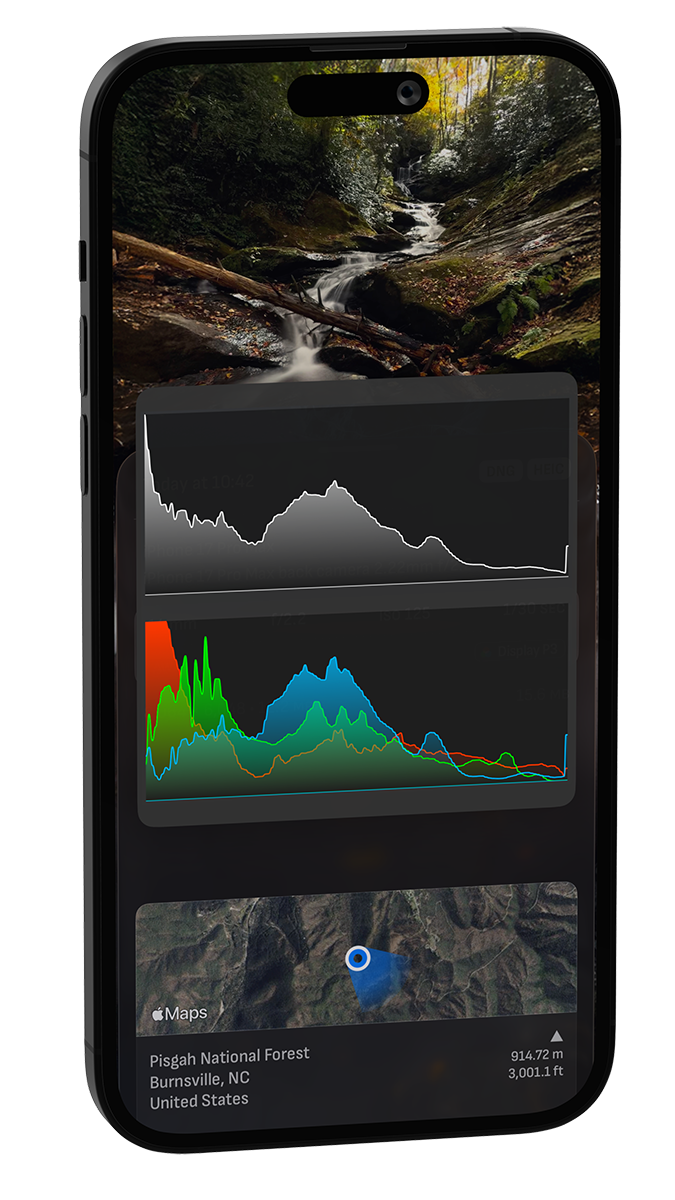
Haptic touch on the RGB histogram to view both RGB and luminance histograms with the most details.